
Quick Answer
A function generator produces a repeating waveform to a shape, frequency, amplitude and offset you choose. It is the source half of a bench: the instrument that puts a known signal into a circuit so that something else can measure what comes out the far end.
Intuition
A signal you specify rather than find
Most test work needs something going in. A filter with nothing at its input is a set of components; the same filter fed a sine of known size and frequency starts telling you what it does. That is the job of a function generator: it produces a waveform whose shape, size, rate and resting level you set, so that everything downstream can be compared against something known.
Four controls do nearly all of it. Shape picks between a sine, a square, a triangle and usually a few more. Frequency sets how many cycles a second. Amplitude sets how big the swing is. Offset slides the whole waveform up or down without changing its size, which is what a circuit running on a single positive supply needs.
Before you touch any of them, know this: the amplitude control is calibrated against an assumption. Most generators are built to drive 50 Ω, and their display reads the amplitude you would get if a 50 Ω load were connected. Connect something else and the reading and the reality part company: an oscilloscope input, which draws almost nothing, sees twice the displayed figure.
A volume control on an amplifier does the same thing in a smaller way. Marked in watts, it means those watts into the loudspeaker impedance the maker assumed. Fit a different loudspeaker and the marking is a rough guide rather than a measurement. The generator's amplitude display is the same kind of number, and Layer 3 shows exactly how far out it can be.
Practitioner
Getting the amplitude you asked for
A generator is quick to set up and easy to set up wrongly, so follow the order below.
- Decide what the circuit under test can survive before setting anything. A generator will happily present ten volts to a three-volt logic input.
- Set the shape, then the frequency, then the amplitude, then the offset. Offset last, because on many instruments the sum of amplitude and offset is limited and the generator will quietly clip if you exceed it.
- Tell the generator what it is driving. Instruments with a load setting need it set to high impedance for a scope input and to 50 Ω for a matched load; get this wrong and every amplitude is out by a factor of two.
- Connect the ground clip first, and to the circuit's own reference rather than to a convenient piece of metal.
- Enable the output, and confirm on a scope what the generator claims it is producing. This step catches the load setting, a clipped offset and a dead lead in one go.
- Change frequency in decades first, then close in. Sweeping slowly through the whole range hunting for a response wastes more time than two coarse steps.
The instrument's own arithmetic is short. Period follows from frequency:
and the average level of a rectangular output follows from its duty:
Worked example — A logic-level clock with an uneven duty
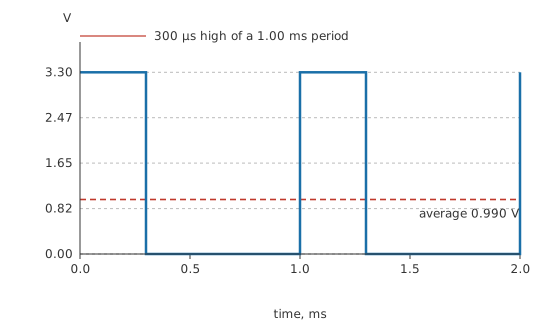
Set a rectangular output at 1.00 kHz, swinging from zero to 3.30 V with a duty of 0.30.
The period is 1.00 ms, so the output sits high for 300 µs of every cycle and low for the rest, a duty of 30 %.
Its average level is 0.990 V, which is what a meter on its DC range would report and what a low-pass filter fed by this signal would settle at. A symmetric square of the same height would average 1.65 V instead, so the duty setting has moved the average by a fifth of the supply without changing the peak by anything at all.
Safety
A generator's own output is harmless at bench levels. Its ground clip is not always harmless, because on a mains-powered instrument that clip is usually bonded to the protective earth of the building.
Clip it to a point in the circuit that is not at earth potential and you have connected that point to earth through the instrument, which is a short circuit that the circuit, the generator or both will lose. On anything mains-connected, transformerless or floating, that fault can also make an exposed metal part live. The same hazard belongs to the oscilloscope, which meets it more often and treats it at length.
The rule while learning is short: the ground clip goes to the circuit's own reference node, and nowhere else, and mains-referenced circuits need an instrument arrangement this lesson does not cover.
Engineer
Source resistance and the load that changes your settings
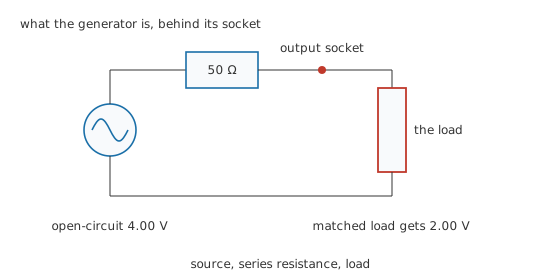
Behind the output socket is a source and a resistance in series with it, and that resistance is deliberate. A defined output resistance, almost always 50 Ω, matches the cables used at radio frequencies and stops reflections from a mismatched far end coming back and confusing the measurement.
It also means the socket cannot deliver its internal voltage to anything. The internal source and the load form a divider:
so the generator's designers set the internal amplitude to twice the number on the display. Ask for 2.00 V peak to peak and the source behind the resistance is really producing 4.00 V. Into a matched 50 Ω load, half of that is dropped internally and the load receives 2.00 V, exactly as promised.
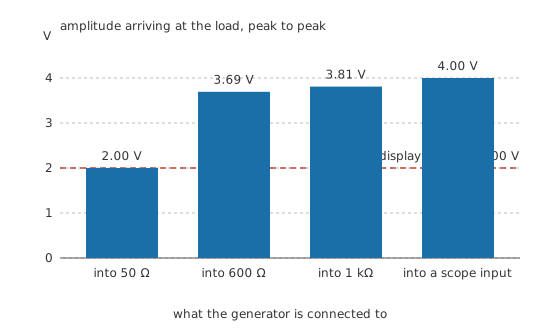
Attach something else and the arithmetic moves. A 600 Ω load takes 3.69 V. A 1 kΩ load takes 3.81 V. An oscilloscope input takes so little that the whole 4.00 V appears, which is double what the panel says and the single most common surprise a beginner meets on a bench.
Four numbers for one waveform
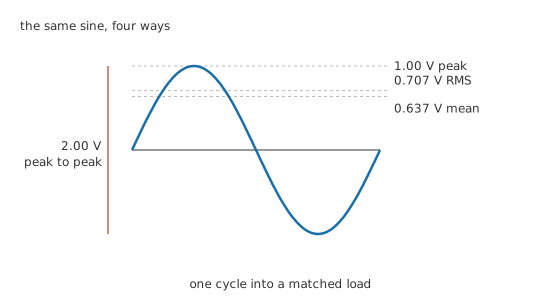
Amplitude has more than one meaning and instruments disagree about which they show. Take the matched case, a sine of 2.00 V peak to peak. Its peak is 1.00 V, half the swing. Its RMS value is smaller again:
giving 0.707 V, which is what an AC meter reports and what sets the heating this signal would produce. The mean of its magnitude, which is what a rectifier-and-average circuit actually collects, is 0.637 V, smaller still. Amplitude measures sets out the family properly.
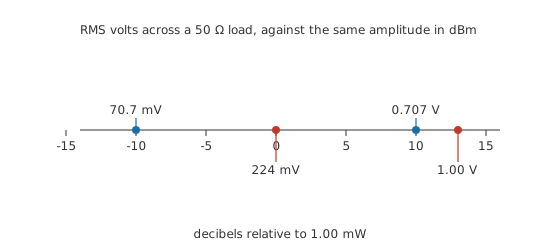
Radio-frequency benches use a fifth: power referred to 1.00 mW, written dBm, which is only meaningful once the resistance is stated.
That sine into 50 Ω delivers 10.0 mW, which is 10.0 dBm. The zero of that scale, 1.00 mW into the same resistance, corresponds to 224 mV RMS.
The edges are not vertical
A square wave is drawn with vertical sides and no instrument produces one. The generator's own bandwidth sets how fast its output can move, and a single-pole response makes that relationship simple:
A generator specified at 25.0 MHz cannot do better than 14.0 ns between the ten and ninety per cent points, an exponential of 6.36 ns rather than a step. On the 3.30 V swing above, that means the output passes 330 mV and 2.97 V that far apart.
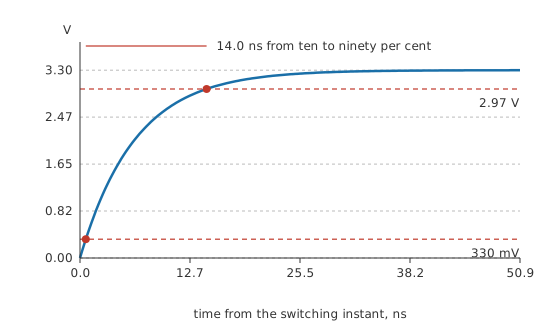
At a kilohertz that is invisible: fourteen nanoseconds out of a millisecond changes nothing you could see or measure. Testing the rise time of a logic gate is another matter, because the generator's own edge would then be slower than the thing being measured, and the result would describe the generator instead of the gate.
The same limit shows up in a subtler way well below the top of the range. A square wave is a fundamental plus a series of odd harmonics, and the generator rolls off the ones above its bandwidth, so a square wave whose fundamental gets close to the specified bandwidth loses its higher harmonics and rounds at the corners, well before the fundamental itself reaches the limit. Harmonics explains where those components come from, and the practical rule that falls out of it is to keep the fundamental at least a decade below the instrument's rating whenever the shape of the edge matters, which keeps enough of the harmonic series intact that the rounding this section describes stays out of sight.
Professional
Generators that are not function generators
The instrument described so far builds its waveform from a stored table and a clock, which is why the same box will produce a sine, a square and a triangle without any change of circuit. That construction leaves fingerprints. The output is a staircase before filtering, its steps set by the sample clock, and a sine near the top of the instrument's frequency range is assembled from fewer points than one near the bottom. Distortion figures therefore vary across the range in a way a dedicated sine oscillator's does not.
Arbitrary waveform generators extend the same idea by letting you supply the table. Anything you can describe as a list of samples becomes an output, which is how a sensor's real signal, a fault condition or a modulated carrier gets replayed into a circuit repeatably. The limits are the sample rate, the memory depth and the reconstruction filter, and all three are stated on the datasheet.
Several instruments on a bench are not function generators at all and are worth telling apart. A signal generator in the radio sense produces a very pure sine of accurately known amplitude, usually with modulation, and is specified on phase noise and level accuracy rather than on shape. A pulse generator produces edges far faster than a function generator can, with independent control of width and delay. A bench power supply produces a constant level and nothing else. Choosing the wrong one usually shows up as a measurement limited by the source.
Two features on a modern generator repay learning early. A sweep runs the frequency across a range while a trigger output marks the start, which turns a filter measurement from twenty manual readings into one trace. A burst emits a counted number of cycles on command, which is how a resonant circuit's ringdown or a receiver's acquisition behaviour gets exercised without a continuous drive.
Synchronising two instruments matters too. Most generators have a reference input and output so several boxes can share one clock, and a trigger or sync output that emits a clean edge once per cycle. Feeding that sync to an oscilloscope trigger input gives a rock-steady display of a signal the scope would otherwise struggle to lock on to, which is often the difference between a measurement and an argument with the trigger controls.
Common mistakes
- Believing the amplitude display into a scope input. With no load setting to correct it, the panel reads half of what the circuit is actually receiving. Confirm the first amplitude of any session on the scope.
- Adding offset until the waveform clips, then blaming the circuit. Most generators limit the sum of amplitude and offset, and the clipping happens silently inside the instrument.
- Clipping the generator's earth to any convenient metalwork. It goes to the circuit's own reference and nowhere else.
- Testing edges with a generator slower than the circuit. A rise time measured this way is the generator's, and no amount of care with the scope will recover the real one.
- Leaving a 50 Ω load setting selected while driving a high-impedance input, or the reverse. It is one menu item and it changes every number in the session.
- Assuming a square wave from a generator has a 50 % duty. Many instruments keep the last duty setting across a shape change, and the average level moves with it even though the peaks do not.
Frequently asked questions
Why does my scope show twice the amplitude the generator displays?
Because the generator's display assumes a matched 50 Ω load and a scope input is nearly open circuit. With no load drawing current, none of the internal source's amplitude is dropped across the internal 50 Ω, so the full internal amplitude appears at the socket. Most instruments have a load setting that corrects the display.
What does the 50 Ω on a generator's output mean?
It is the resistance in series with the internal source, chosen to match the cables and terminations used at high frequency so that signals do not reflect back down the lead. It also forms a divider with whatever load you connect, which is why the delivered amplitude depends on the load.
What is dBm and why is it not just volts?
It is a power level referred to one milliwatt, expressed in decibels. Converting it to volts needs the resistance it is delivered into, so a dBm figure without a stated impedance is incomplete. On a 50 Ω bench, zero dBm is about 224 mV RMS.
Can a function generator replace a bench power supply?
No. Its output resistance is high by supply standards, its current capability is small, and it has no current limit worth the name. Use it for signals and a supply for rails.
Why is my square wave rounded at the corners?
Some of the rounding is the generator's own bandwidth, which sets the fastest edge it can produce. The rest is usually the cable and the circuit: capacitance at the far end of a lead slows an edge further, and a scope of limited bandwidth rounds what it sees on top of that.