
Quick Answer
Amplitude measures describe how big an alternating waveform is. The peak value is the largest excursion from the centre of the swing, the peak-to-peak value spans the lowest point to the highest, and the instantaneous value is whatever the waveform reads at one chosen moment. Each convention gives a different number for the same signal.
Intuition
How big is something that keeps changing
A steady voltage has one size. Ask how big a 9 V battery is and the answer is 9 V, this morning and next Tuesday. An alternating voltage has no single size, because it is different at every instant: zero, then climbing, then at its largest, then back down through zero and negative, hundreds or thousands of times a second.
Any single number quoted for such a signal is therefore a convention, a rule about which moment or which span you mean.
The peak value is the furthest the waveform gets from the middle of its swing. The peak-to-peak value is the whole span, from the lowest point the wave reaches to the highest, and for a wave that swings equally either side of zero it comes to twice the peak. The instantaneous value is the plain answer to the question "what is it right now", and it is true only for the moment it was taken.
A fourth figure is quoted at least as often as those. The RMS value answers a different question: what steady voltage would heat a resistor as much as this changing one does.
None of them is more correct than the others. They answer different questions about the same sine wave and they come out to different numbers, so a bare figure with no convention attached leaves a reader with no way to recover the signal that was meant.
Practitioner
What the scope shows and what the meter shows
The two instruments on most benches answer in different conventions. An oscilloscope draws the waveform itself, so peak and peak-to-peak come straight off the trace: it has a top and a bottom, and the vertical distance between them is the peak-to-peak value. A multimeter on its AC range gives back one number, and that number is RMS.
For a sine wave the two are locked together by a fixed ratio:
Worked example — One bench sine, three figures
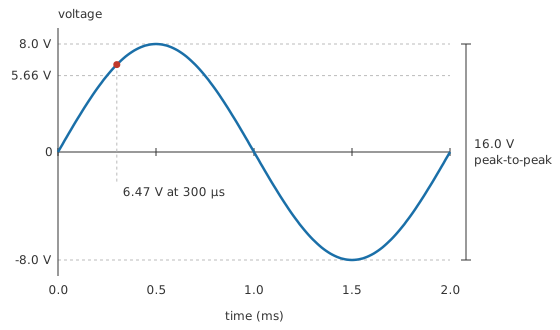
A function generator is set for a sine of 8.0 V peak.
The trace on a scope spans 16.0 V from its lowest point to its highest, since a wave centred on zero reaches as far below the centre as above it.
A meter across the same output reads 5.66 V, the peak divided by the square root of two.
All three describe one signal, and nothing about that signal changed while the readings were taken.
A scope will compute all of these from the captured trace and offer them in a measurement menu, under names that vary a little between makes: Vpp, Vmax, Vmin, Vamp, Vrms. Vmax and Vmin are the extreme instantaneous samples in the captured window. Vamp is the peak-to-peak of the waveform proper, with overshoot and noise excluded. Picking the wrong row off that menu is a routine source of confusion, and on a real signal the two rows can differ by a good deal.
Specifications use whichever convention suits the parameter, and the good ones say which. Supply ripple is normally quoted peak-to-peak, because the whole excursion is what the load sees. An absolute maximum rating is a peak, because one instant above it is enough to do damage. An amplifier's output power implies an RMS voltage into a stated load. Where a datasheet gives a bare figure for an alternating quantity, the surrounding text almost always names the convention somewhere, and a specification that never names it is worth distrusting.
Every one of these numbers is measured with respect to something, so ground belongs in the discussion. A probe's ground clip fixes what zero means on the display, and moving it to a different point in the circuit changes the whole list of readings.
Engineer
Amplitude when the wave is not centred on zero
All of those figures come off a single expression. A sine of a given amplitude, at a given frequency, has a definite value at every instant:
The peak value sets the height. The symbol ω is the angular frequency, 2π times the frequency in hertz, which counts radians per second instead of cycles per second. The symbol φ fixes where in the cycle the clock starts. Feed a time into the expression and out comes the instantaneous value. The largest value it ever reaches is the peak. Square it, average the square over a whole cycle, take the root of the average, and you have the RMS value. Each convention is a different question put to one function.
Worked example — Reading one instant
The bench sine of 8.0 V peak is running at 500 Hz, so a complete cycle lasts 2.0 ms.
Timed from an upward zero crossing, the waveform's value at 300 µs is 6.47 V.
That figure belongs to one moment. A microsecond later the waveform has moved on, while neither the peak nor the RMS value shifted at all.
A DC offset changes neither the shape of the alternation nor its size. It moves the level the alternation happens about, so the maximum and the minimum both travel with it while the distance between them stays where it was.
Worked example — A sine riding on a DC level
A sine of 2.0 V peak sits on a steady 3.0 V.
The waveform now runs between a maximum of 5.0 V and a minimum of 1.0 V, so its peak-to-peak value is 4.0 V — exactly what it would be with no offset at all.
The word "peak" has stopped being safe here. It could mean the amplitude of the alternation, 2.0 V, or the highest instantaneous value the waveform reaches, 5.0 V.
What a meter reports depends on how its input is coupled. AC-coupled, it blocks the steady part and returns 1.41 V. DC-coupled and true-RMS, it includes the offset and returns 3.32 V, because the steady and the alternating contributions add as squares.
The ratio of peak to RMS carries a name of its own, the crest factor, and for a sine it is the square root of two: 1.41. It is a shape number, so scaling a signal up or down leaves it untouched. A square wave has a crest factor of one, since it spends all its time at its extremes; a narrow pulse train has a large one, since it spends most of its time at nothing much. Square, triangle and other waveforms works through the shapes properly.
The expression above carries assumptions, and they mark where these conventions stop being dependable. It describes a single frequency, so a real waveform carrying harmonics or noise reaches extremes the sine expression cannot predict, set by how the components happen to line up in time. It also assumes repetition; without a repeating signal, "the peak" belongs to the interval you happened to look at instead of to the signal. A one-off event has no peak in that sense, only a largest value so far. Nothing in the expression allows for the instrument either: a measured peak is worth only as much as the bandwidth and sample rate behind it, and a narrow spike is the first thing a slow instrument rounds away. RMS value takes the general case on, for waveforms that are not sines at all.
Professional
Which figure the hardware has to survive
The peak and the RMS value size different parts of a design. Peak decides what has to survive: the rail the signal must fit inside, the reverse voltage on a rectifier, the rating on a capacitor, the input range of a converter. RMS decides what gets hot: dissipation in a resistor, heating in a winding, the current a track can carry. Design against the wrong one and the circuit either cooks or clips.
Worked example — Equal heating, unequal peaks
Take a waveform whose crest factor is 3.0, carrying the same RMS value as the bench sine, 5.66 V.
Its peak reaches 16.97 V, against the sine's 8.0 V.
The two deliver identical heating into a resistor. The peakier one needs more than twice the headroom to get through a stage without clipping.
Audio is where that gap bites hardest. Speech and music sit well above a sine in crest factor, so an amplifier sized on average power runs out of rail on transients long before it runs out of heat. Compression buys some of the headroom back and pays for it in dynamics.
Instruments run into the same wall. A true-RMS meter is specified for a maximum crest factor, above which its own front end clips and the reading falls low, and that specification usually tightens as the reading approaches full scale. An averaging meter fails earlier and with less warning: it rectifies, averages, and multiplies by a constant chosen for a sine, so on a chopped or pulsed waveform the display has no defined relationship to anything.
Peak measurements on a scope are pushed around by whatever else rides on the trace. Vmax and Vmin latch onto the single most extreme sample in the record, so ambient noise, a probe picking up switching hash, or one ringing edge will all inflate the peak-to-peak figure. Averaging the acquisition pulls it back for a repetitive signal, at the cost of hiding genuine intermittent spikes; peak-detect mode exists to catch those. Limited bandwidth pushes the other way and rounds narrow peaks off, so one signal can measure both high and low depending on how the instrument was set up.
Conventions also differ between disciplines, and a specification written in someone else's default is a reliable way to be out by a factor of two. Power engineering quotes RMS unless it says otherwise, so an unqualified mains figure is an RMS figure. RF work quotes power into a reference impedance. Digital design mostly cares about instantaneous levels against thresholds, since a logic input only asks whether the voltage was above or below a boundary at the moment it was sampled (analog vs digital).
Common mistakes
- Comparing a peak reading with an RMS one — a scope and a meter on the same sine differ by a factor of about 1.4, and both are telling the truth about different things.
- Quoting an amplitude without its convention — "five volts of signal" describes three different waveforms. Name peak, peak-to-peak or RMS every time the number leaves your hands.
- Applying the root-two ratio to anything but a sine — square, triangular and pulsed waveforms each have their own peak-to-RMS relationship, and a narrow pulse is nowhere near root two.
- Calling the highest point of an offset waveform "the peak" — that number and the amplitude of the alternation part company as soon as a DC level is present. Peak-to-peak is the one figure that stays unambiguous.
- Trusting a peak-to-peak reading on a noisy trace — the measurement takes the two most extreme samples in the record, so noise and ringing both inflate it.
- Sizing a supply rail from an RMS figure — clipping happens at the peak, so headroom has to be worked out from the peak and the crest factor that connects the two.
Frequently asked questions
What is the difference between peak and peak-to-peak?
Peak is measured from the centre of the swing out to one extreme. Peak-to-peak spans both extremes. For a waveform centred on zero the peak-to-peak value is twice the peak; once a DC offset is present the two figures come apart.
Which value does an oscilloscope show?
The waveform itself, so peak, peak-to-peak and instantaneous values all come straight off the trace. Most scopes will also compute an RMS figure from the captured samples and list it separately in the measurement menu.
Does a DC offset change the peak-to-peak value?
No. Shifting the whole waveform moves its maximum and its minimum by the same amount and leaves the distance between them alone. It does move the highest instantaneous value, so the word 'peak' turns ambiguous once an offset is present.
What is crest factor?
The ratio of a waveform's peak to its RMS value. A sine's is the square root of two, a square wave's is one, and a narrow pulse train's is large. It is a property of shape, so scaling the signal does not change it.
Why do my scope and my multimeter disagree about the same signal?
They are almost certainly reporting different conventions. Check whether the meter is AC-coupled, whether it is a true-RMS instrument, and which row of the scope's measurement menu you are reading.