
Quick Answer
Resolution is the smallest change an instrument can display. Accuracy is how far its reading may sit from the truth, stated in its specification. The two are independent, so a meter can show four decimal places and still be wrong in the second one.
Intuition
A reading is a range, not a number
A display shows digits, and digits look definite. They are not. Every reading is a claim that the true value lies somewhere within a band around what is shown, and the width of that band is a property of the instrument, published on its datasheet and not on its screen.
Three words separate what people usually run together. Resolution is the smallest change the display can show, which comes from how finely the instrument divides a range. Accuracy is how close the reading is to the truth. Precision, or repeatability, is how closely repeated readings of the same thing agree with each other.
A bathroom scale makes the distinction concrete. One reading to a tenth of a kilogram has excellent resolution. Step on and off five times and get the same figure each time and it has good repeatability too. Neither fact tells you whether it has been checked against a known weight, and if it reads half a kilogram heavy it will do so with all the resolution and all the repeatability it possesses.
Instruments behave the same way, and the three properties come from different parts of the design. Resolution comes from the converter. Repeatability comes from noise and from mechanical stability. Accuracy comes from the reference the instrument compares against, and from how recently that reference was itself checked.
Practitioner
Reading a specification
A meter's accuracy is quoted in two parts, and the reason it takes two is that the instrument has two different kinds of error. Some of the error scales with the reading, because a gain is slightly wrong. The rest is fixed, because an offset and the last digit are the same size whatever is being displayed.
The first term is a percentage of the reading, so it shrinks and grows with whatever is on the screen. The second is a number of counts, and a count is one step of the display, whose size is set by the range in use rather than by the reading:
Worked example — One meter, one specification, three answers
Take a 6000-count meter specified at plus or minus 0.5 % of reading plus 3 counts.
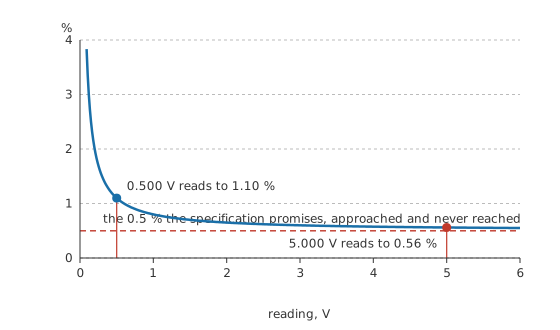
On its 6.000 V range, one count is 1.00 mV. A reading of 5.000 V is then uncertain by 28.0 mV, which is 0.56 % of the reading.
Read 0.500 V on that same range and the proportional term shrinks with it while the counts term does not. The uncertainty is 5.50 mV, which is 1.10 % of the reading: twice as bad, on the same meter, measuring a smaller voltage.
Switch to the 600.0 mV range, where one count is 0.100 mV, and read the same 0.500 V again. Now the uncertainty is 2.80 mV, or 0.56 %, back where it was. Choosing the range is not cosmetic. It is worth a factor of two here and more at smaller readings still.
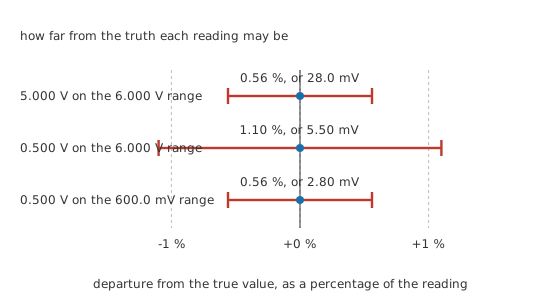
Notice what the second reading in that example costs. The meter is the same meter and the voltage is the same voltage, and the answer has still gone from trustworthy to half a digit past useful, purely because the reading was sitting near the bottom of a range that could hold ten times more.
The habits that follow are short. Use the lowest range that holds the reading. Quote the uncertainty alongside the value when it matters, because a number without one is an assertion rather than a measurement. And check whether the specification you are reading applies at all: accuracy figures come with a temperature range and a time since calibration attached, and both of them are conditions rather than decoration.
Engineer
Where the two terms of the specification cross
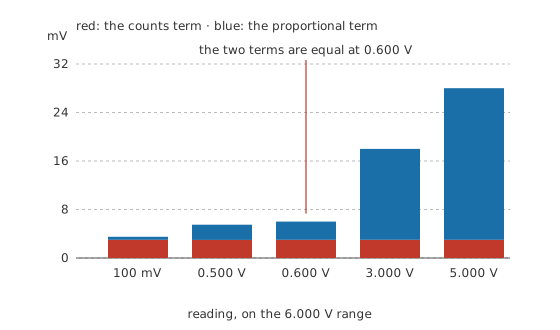
The fixed term and the proportional term are equal at exactly one reading. Below it the fixed term dominates and the percentage of reading gets steadily worse; above it the proportional term takes over and the percentage settles down.
On the 6.000 V range that crossing point is 0.600 V, which is a tenth of full scale. That is where the working rule about treating the bottom tenth of a range with caution comes from: it is not superstition but the point at which a fixed error stops being small compared with what it is added to. Instruments quoted only as a percentage of full scale behave the same way and hide it better, because the percentage they quote is of the range rather than of your reading, and at a tenth of full scale it is ten times worse than it appears.
Plot the total as a percentage of the reading and the shape is a curve that falls towards the quoted percentage and never reaches it.
Resolution is not accuracy
The display steps in 1.00 mV, and the truth may be anywhere within 28.0 mV of the reading. Those two numbers differ by a factor of 28.0, so the last two digits of a five-digit display are inside the uncertainty and carry no information about the thing being measured.
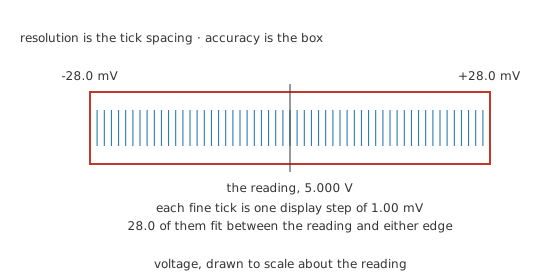
Those digits are not useless. They are extremely useful for watching a change, because a systematic error common to two readings cancels when you subtract them. A meter that is half a per cent high reports a rise of ten millivolts as a rise of ten millivolts, to the resolution of its display. Resolution buys you differences; accuracy buys you absolutes.
Repeatability is a different question again
Take five readings of the same voltage: 4.982 V, 4.985 V, 4.983 V, 4.986 V and 4.984 V. Their spread is 4.00 mV, which is excellent. Their mean is 4.984 V, which sits -16.0 mV from the true 5.000 V.
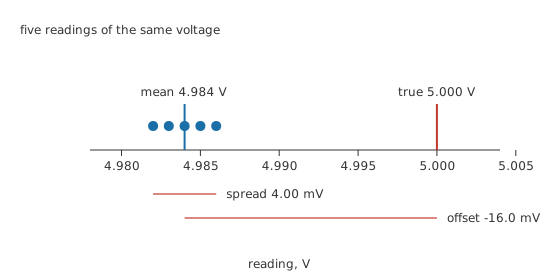
Averaging attacks the spread and leaves the offset untouched, because a systematic error is present identically in every reading. The distinction matters when someone reports a value to more digits than their instrument's accuracy supports on the grounds that they took a hundred readings. They have measured the same wrong number a hundred times, very carefully.
Two uncertain readings make a third
Divide one measured quantity by another and the answer inherits both uncertainties. Take the 5.000 V above, good to 0.56 %, and a current of 12.5 mA on a 60.00 mA range, where one count is 10.0 µA and the specification is 1.0 % of reading plus the same 3 counts, giving 155 µA or 1.24 %.
The resistance is 400 Ω. If both errors happen to push the same way, the answer is out by 1.80 %, or 7.20 Ω. If they are independent, which is the usual assumption for two separate specifications, they combine as a root sum of squares to 1.36 %, or 5.44 Ω.
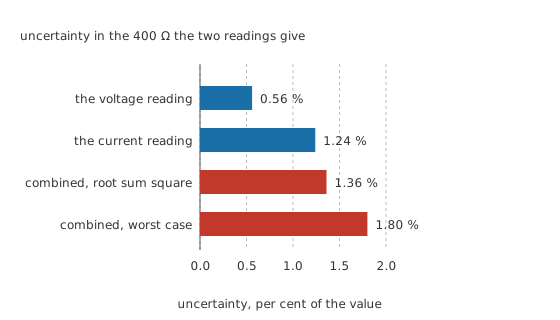
Either way the derived value is less certain than either reading, and quoting it to four digits would be inventing precision. Engineering notation covers how many digits it is honest to write down.
Professional
Traceability and the chain behind the number
An accuracy specification is a claim about how far a reading can be from the truth, and that claim only means something if the instrument has been compared against something better. Calibration is that comparison, and it produces a certificate stating what was found rather than a sticker saying the instrument is fine.
The reference an instrument is compared against was itself compared against a better one, and so on up a chain that ends at a national measurement institute and, ultimately, at the definitions of the SI units themselves. That chain is what the word traceable means, and a calibration certificate names the standards used and their own uncertainties for that reason. An instrument with no traceable chain behind it has a number on its screen and no argument for it.
Specifications also carry conditions that are easy to skip. A figure quoted for a stated temperature range gains a further term outside it, usually stated per degree. A figure quoted for one year since calibration is a different, tighter figure at ninety days. A DC voltage specification says nothing about the AC ranges, whose accuracy is usually worse and is quoted only over a stated frequency band and up to a stated crest factor.
Some errors are not in the instrument at all. Meter loading changes the circuit and is invisible to any accuracy specification. Thermal voltages at the junction of dissimilar metals produce tens of microvolts that no calibration removes. Interference at mains frequency adds a component that a bench meter integrating over a whole number of mains cycles rejects and a handheld one may not. Each of these can be larger than everything on the datasheet.
The reason to think about any of this is that most decisions do not need precision, and the few that do need it badly. Checking that a rail is roughly right needs one significant figure. Deciding whether a batch of parts meets a tolerance means comparing a measurement against a limit, and the uncertainty of the measurement has to be small compared with the tolerance or the test decides nothing. Knowing which situation you are in is most of the skill, and it is the same judgement reading datasheets asks for on the component side.
Common mistakes
- Treating extra digits as extra accuracy. Resolution and accuracy come from different parts of the instrument, and a display can step far finer than the reading is trustworthy.
- Measuring at the bottom of a range because it saves reaching for the range switch. The fixed part of the specification stays the same size while the reading shrinks, so the percentage error grows.
- Averaging a hundred readings and quoting more digits. Averaging reduces the spread and leaves any systematic error exactly where it was.
- Applying a DC voltage specification to an AC reading. The AC ranges have their own figures, usually worse, and valid only over a stated frequency band.
- Writing down a derived value to more digits than its inputs support. Two readings each good to about one per cent make a ratio good to a bit more than one per cent, not to four figures.
- Reading a specification without its conditions. Temperature range and time since calibration are part of the claim, not footnotes to it.
Frequently asked questions
What does plus or minus 0.5 % plus 3 counts mean?
The uncertainty is half a per cent of whatever you are reading, plus three times the size of one display step on the range in use. The first part scales with the reading and the second does not, so the total is a larger fraction of small readings than of large ones.
Is a meter with more digits more accurate?
No. Digits are resolution, which is how finely the instrument divides its range. Accuracy is a separate specification describing how far the reading can be from the truth, and it comes from the instrument's internal reference and its calibration.
Why is my reading worse at the bottom of a range?
Because the counts part of the specification is a fixed number of display steps, so it stays the same size while the reading shrinks. Below about a tenth of full scale it dominates, and switching down a range fixes it.
Does averaging make a measurement more accurate?
It makes it more repeatable by reducing random scatter. It does nothing to a systematic error, which appears identically in every reading and survives any amount of averaging.
What does traceable calibration mean?
That the instrument was compared against a reference, which was compared against a better one, in an unbroken chain reaching a national measurement institute and the SI definitions. The certificate names the standards used and their uncertainties, which is what turns an accuracy claim into something you can rely on.