
Quick Answer
A datasheet is a manufacturer's specification for a part: what it guarantees, under what conditions, and what will damage it. Reading one means separating the guaranteed limits from the typical figures, and both from the conditions attached to them. The headline number on the front page is rarely the one a design has to survive.
Intuition
What the document is actually promising
A datasheet reads like a description and binds like a contract. The parts of it that bind are narrow, the parts that describe are broad, and the two are printed in the same typeface a page apart.
A tenancy agreement is laid out the same way. The advertisement quotes a rent. The agreement sets out when the deposit comes back, what counts as fair wear, which repairs are yours and which are the landlord's, and how much notice any of it takes. Nobody signs the advertisement. A datasheet asks for the same reading: find the clauses that bind, and notice which numbers are only description.
The two kinds diverge at the very top of the electrical tables. Absolute maximum ratings say what the part survives. A supply pin whose absolute maximum is 36.0 V will not necessarily fail the moment it reaches 36.0 V, and it will not necessarily work there either. Below that sit the recommended operating conditions, which say where the rest of the document applies: 4.5 V to 32.0 V in this illustration, a window 27.5 V wide. Between the top of that window and the absolute maximum lies 4.0 V, or 12.5 % of the recommended ceiling.
A design sitting inside that strip may behave perfectly on the bench — no table covers it, so nobody measured the part there, and the next production lot carries no obligation to behave the same way.
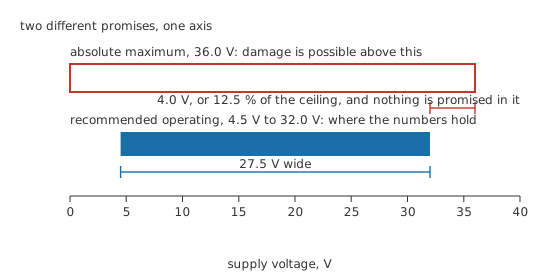
The outer span is what the part endures. The inner one is what the document is about.
Practitioner
Three columns and a conditions cell
Minimum and maximum are the guarantee. Where one of those cells holds a number, the manufacturer is committing that production parts fall inside it under the stated conditions, and a part that does not is a return. Typical is a different kind of claim. It describes the middle of a distribution, it usually comes from characterising a sample rather than from testing every part, and no individual device is promised to be near it. A row with a typical figure and blank limit cells carries no guarantee at all.
Take a voltage reference specified 1.180 V minimum, 1.250 V typical and 1.320 V maximum. That band is 140 mV wide, 70.0 mV below typical and 70.0 mV above it, which is 11.2 % of the typical figure end to end. A design that took 1.250 V as the reference voltage assumed a point where the part offered a band, and the parts that arrive will be spread across it. Passive components are read the same way, and resistor tolerance and precision does the same job for a marked resistance.
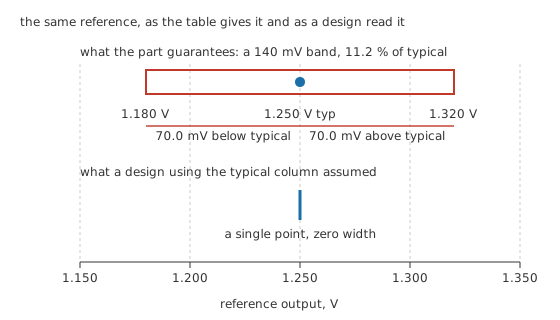
The red span is the promise. The blue hairline is what a typical-column design believed, drawn at the same scale.
Whatever the reference feeds inherits that band.
Worked example — The band arrives at the output
A divider of 8.20 kΩ over 3.30 kΩ hangs on the reference and sets a comparator threshold.
At the typical reference the threshold is 358.7 mV. At the guaranteed minimum it falls to 338.6 mV, at the guaranteed maximum it rises to 378.8 mV, and the spread between those two is 40.2 mV.
That spread is 11.2 % of the nominal threshold, and the reference's own band was 11.2 % of its typical value. A ratio divider scales the value and the band by the same factor, so the fraction passes through untouched, and buying tighter resistors does nothing about it.
The conditions column is where most misreadings start. Every number in the table is quoted at something: a supply voltage, a load, a temperature, a frequency, sometimes a duty cycle or a settling time. Move away from those and the number moves, and how far it moves is usually described by a curve further down the document rather than by the table. Rows that appear to contradict each other almost always differ in a condition.
Engineer
Tables, curves, and specifications written as arithmetic
The condition beside the number
A resistance a table gives as 150.0 Ω is a resistance at whatever temperature sits in the conditions cell next to it. Say that cell reads 25.0 °C, with a temperature coefficient of 800 ppm/°C quoted a few rows down. Both figures are an arithmetic illustration here rather than any real part's specification.
Run the part at 70.0 °C and the 45.0 °C rise takes it to 155.4 Ω, a move of 5.40 Ω, or 3.60 %. That is small enough to ignore in a pull-up and large enough to matter in a divider that sets a threshold, and which case you are in depends on the circuit rather than on the size of the number. Temperature effects on resistance covers the mechanism, and the point here is narrower: the quoted value was never a property of the part on its own.
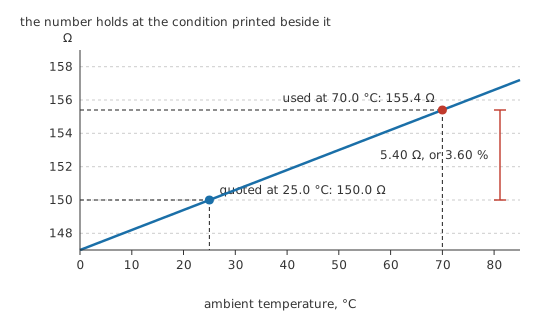
Both dots are the same specification. They differ only in the condition attached to it.
Taking a value off a curve
Below the tables come the characteristic curves — a different sort of document altogether. A curve is normally typical performance drawn from a small number of parts, and it carries no guarantee even where the same quantity has a guaranteed row in the table above it. Curves exist to answer what a table cannot: how a quantity moves between the two temperatures listed, what happens at a load nobody tabulated, where a shape turns over.
Reading one is a construction rather than a glance. Find the operating point on the horizontal axis, go up to the curve, go across to the vertical axis, and read where you land. The figure below does exactly that on a straight line, drawn from a pass element modelled as 1.20 Ω so the curve is computable to the last digit:
At 250 mA the construction lands on 300 mV. Real curves bend, and a part's own datasheet is the authority for its shape; the straight line is here so the read-off has something honest to read.
That construction is only as good as the axis lets it be. On a logarithmic axis a fixed distance across the paper is a fixed ratio in the value, so an eye that places the point to within one part in 20 of a decade has placed the value to within 12.2 % on the high side and -10.9 % on the low side, a fixed fraction of a decade rather than a symmetric percentage. That is about the thickness of the printed line. It is also the reason a number lifted off a curve should be written down with fewer digits than the axis labels invite, a habit engineering notation sets out.
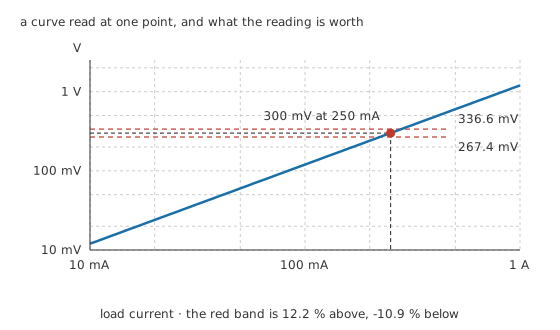
The red band is the read-off tolerance drawn at the figure's own scale, not an error bar the curve carries.
When the row is a formula
Some rows are not one number but a small formula, and instrument accuracy is the one most people meet first.
Take a meter specified plus or minus 0.5 % of reading plus 3 counts, working on a 2.0000 V range with 20000 counts, which puts one display step at 0.100 mV. At 0.1000 V the total comes to 0.800 mV, which is 0.80 % of the reading. At 0.6000 V it is 3.30 mV, or 0.55 %. At 1.8000 V it is 9.30 mV, or 0.517 %.
The fixed term is identical in all three lines and the fraction of the reading it represents is not, so the worst percentage belongs to the smallest reading. Any specification written as a proportional term plus a fixed one behaves this way, whether the fixed part is called counts, digits, an offset or a floor. Accuracy, resolution and measurement error works the instrument case through in full, including the reading at which the two terms are equal.
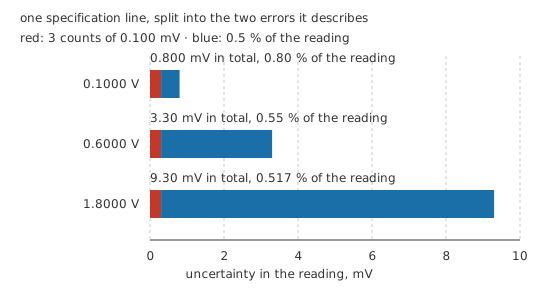
Red is the fixed term and blue the proportional one, three readings on one scale.
Professional
Reading around the edges of the document
A datasheet is written by people who know what they measured and are careful about what they claim. What it leaves out is rarely hidden — it is simply absent, and a reader expecting a complete account of the part fills the gaps with assumptions.
The front page is the first place that happens. Marketing figures live there, and they are true in the sense that some part achieved them under some condition. A cover naming 25.0 µA of quiescent current is naming a typical figure at one temperature. The table underneath may allow 40.0 µA at 25.0 °C and 60.0 µA across the temperature range the part is sold for. A battery estimate built on the cover figure is short by 35.0 µA, a factor of 2.40, and the arithmetic looks healthy all the way to the field.
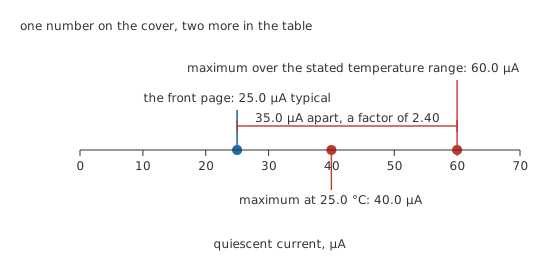
One document, three figures for the same quantity, and only two of them are promises.
Behind that sits the difference between testing and characterising. Production testing costs seconds on every part shipped, so manufacturers test what they guarantee and characterise the rest on samples in a laboratory. Guaranteed limits come from the first activity, typical figures and curves from the second. A parameter with a typical value and empty limit cells has usually been measured on a handful of devices and never tested on yours.
Revisions matter more than they look. A datasheet carries a document number and a revision, and limits, pin descriptions and occasionally a pinout change between them. A design verified against one revision is verified against that revision and nothing else. Errata, where a manufacturer publishes them, are a separate document again and worth asking for by name.
Then there are the sections almost everyone skips. Package thermal data decides how much power the part can dissipate on your board rather than on the manufacturer's test board, and the two can differ by a large factor. Moisture sensitivity levels and reflow profiles decide whether the part survives assembly at all. Ordering codes separate temperature grades and packing options that look identical in a parametric search. Application circuits are illustrations, and their component values are starting points rather than specifications unless the text says otherwise.
What makes the whole document manageable is reading it against a question. Nobody reads a datasheet cover to cover. You arrive wanting to know whether the part works at your supply, whether it holds its accuracy at your temperature, what it does to your battery life. Find the row, read the conditions cell, check whether the row is a limit or a typical, and decide whether the answer is comfortable or marginal. Most decisions need one significant figure and a look at the conditions; a few need the whole worst-case stack, and telling those apart is the same judgement accuracy, resolution and measurement error asks for on the instrument side. Where the document does not answer the question, the answer is to ask the manufacturer rather than to interpolate.
Common mistakes
- Designing at an absolute maximum rating. It is a survival limit, not an operating point, and none of the specifications in the document apply there.
- Reading a typical figure as a guarantee. Typical describes a distribution the manufacturer characterised; the limit columns are what production parts are held to.
- Lifting a number out of a table without its conditions cell. The same parameter appears several times at different supplies, loads and temperatures, and the row you want is the one whose conditions match yours.
- Trusting a characteristic curve to the precision of its axis labels. A curve is typical performance read by eye, and on a logarithmic axis a small slip on the paper is a large slip in the value.
- Treating the front page and the parametric table as the same document. The cover quotes what the part can do; the table states what every part must do.
Frequently asked questions
What is the difference between an absolute maximum rating and a recommended operating condition?
An absolute maximum is a stress limit: exceed it and damage becomes possible, and the manufacturer makes no claim about the part working there. Recommended operating conditions describe the range over which the rest of the datasheet's numbers apply. The strip between the two is survivable and unspecified.
Does typical mean average?
Roughly, and it is not a guarantee either way. A typical figure describes the centre of a distribution measured on a sample of parts, usually at one temperature and one supply. Individual devices are held only to the minimum and maximum columns, and where those are blank there is nothing to hold them to.
Are the curves in a datasheet guaranteed?
Normally not. They are usually labelled typical performance characteristics, drawn from a small number of parts, and they exist to show how a quantity behaves between the points the tables give. Design against the tabulated limits and use the curves to understand shape and trend.
Why do two copies of the same datasheet disagree?
Because they are different revisions. Limits get tightened or relaxed, conditions get restated, and occasionally a pin description is corrected. Note the document number and revision alongside a design, and check for a newer one before a production run.
How do I read a specification written as a percentage plus a fixed amount?
Work out both terms at your actual operating point and add them. The percentage scales with the quantity being measured and the fixed part does not, so the total is a much larger fraction of a small reading than of a large one.